Hardware Monitoring
1. Introduction
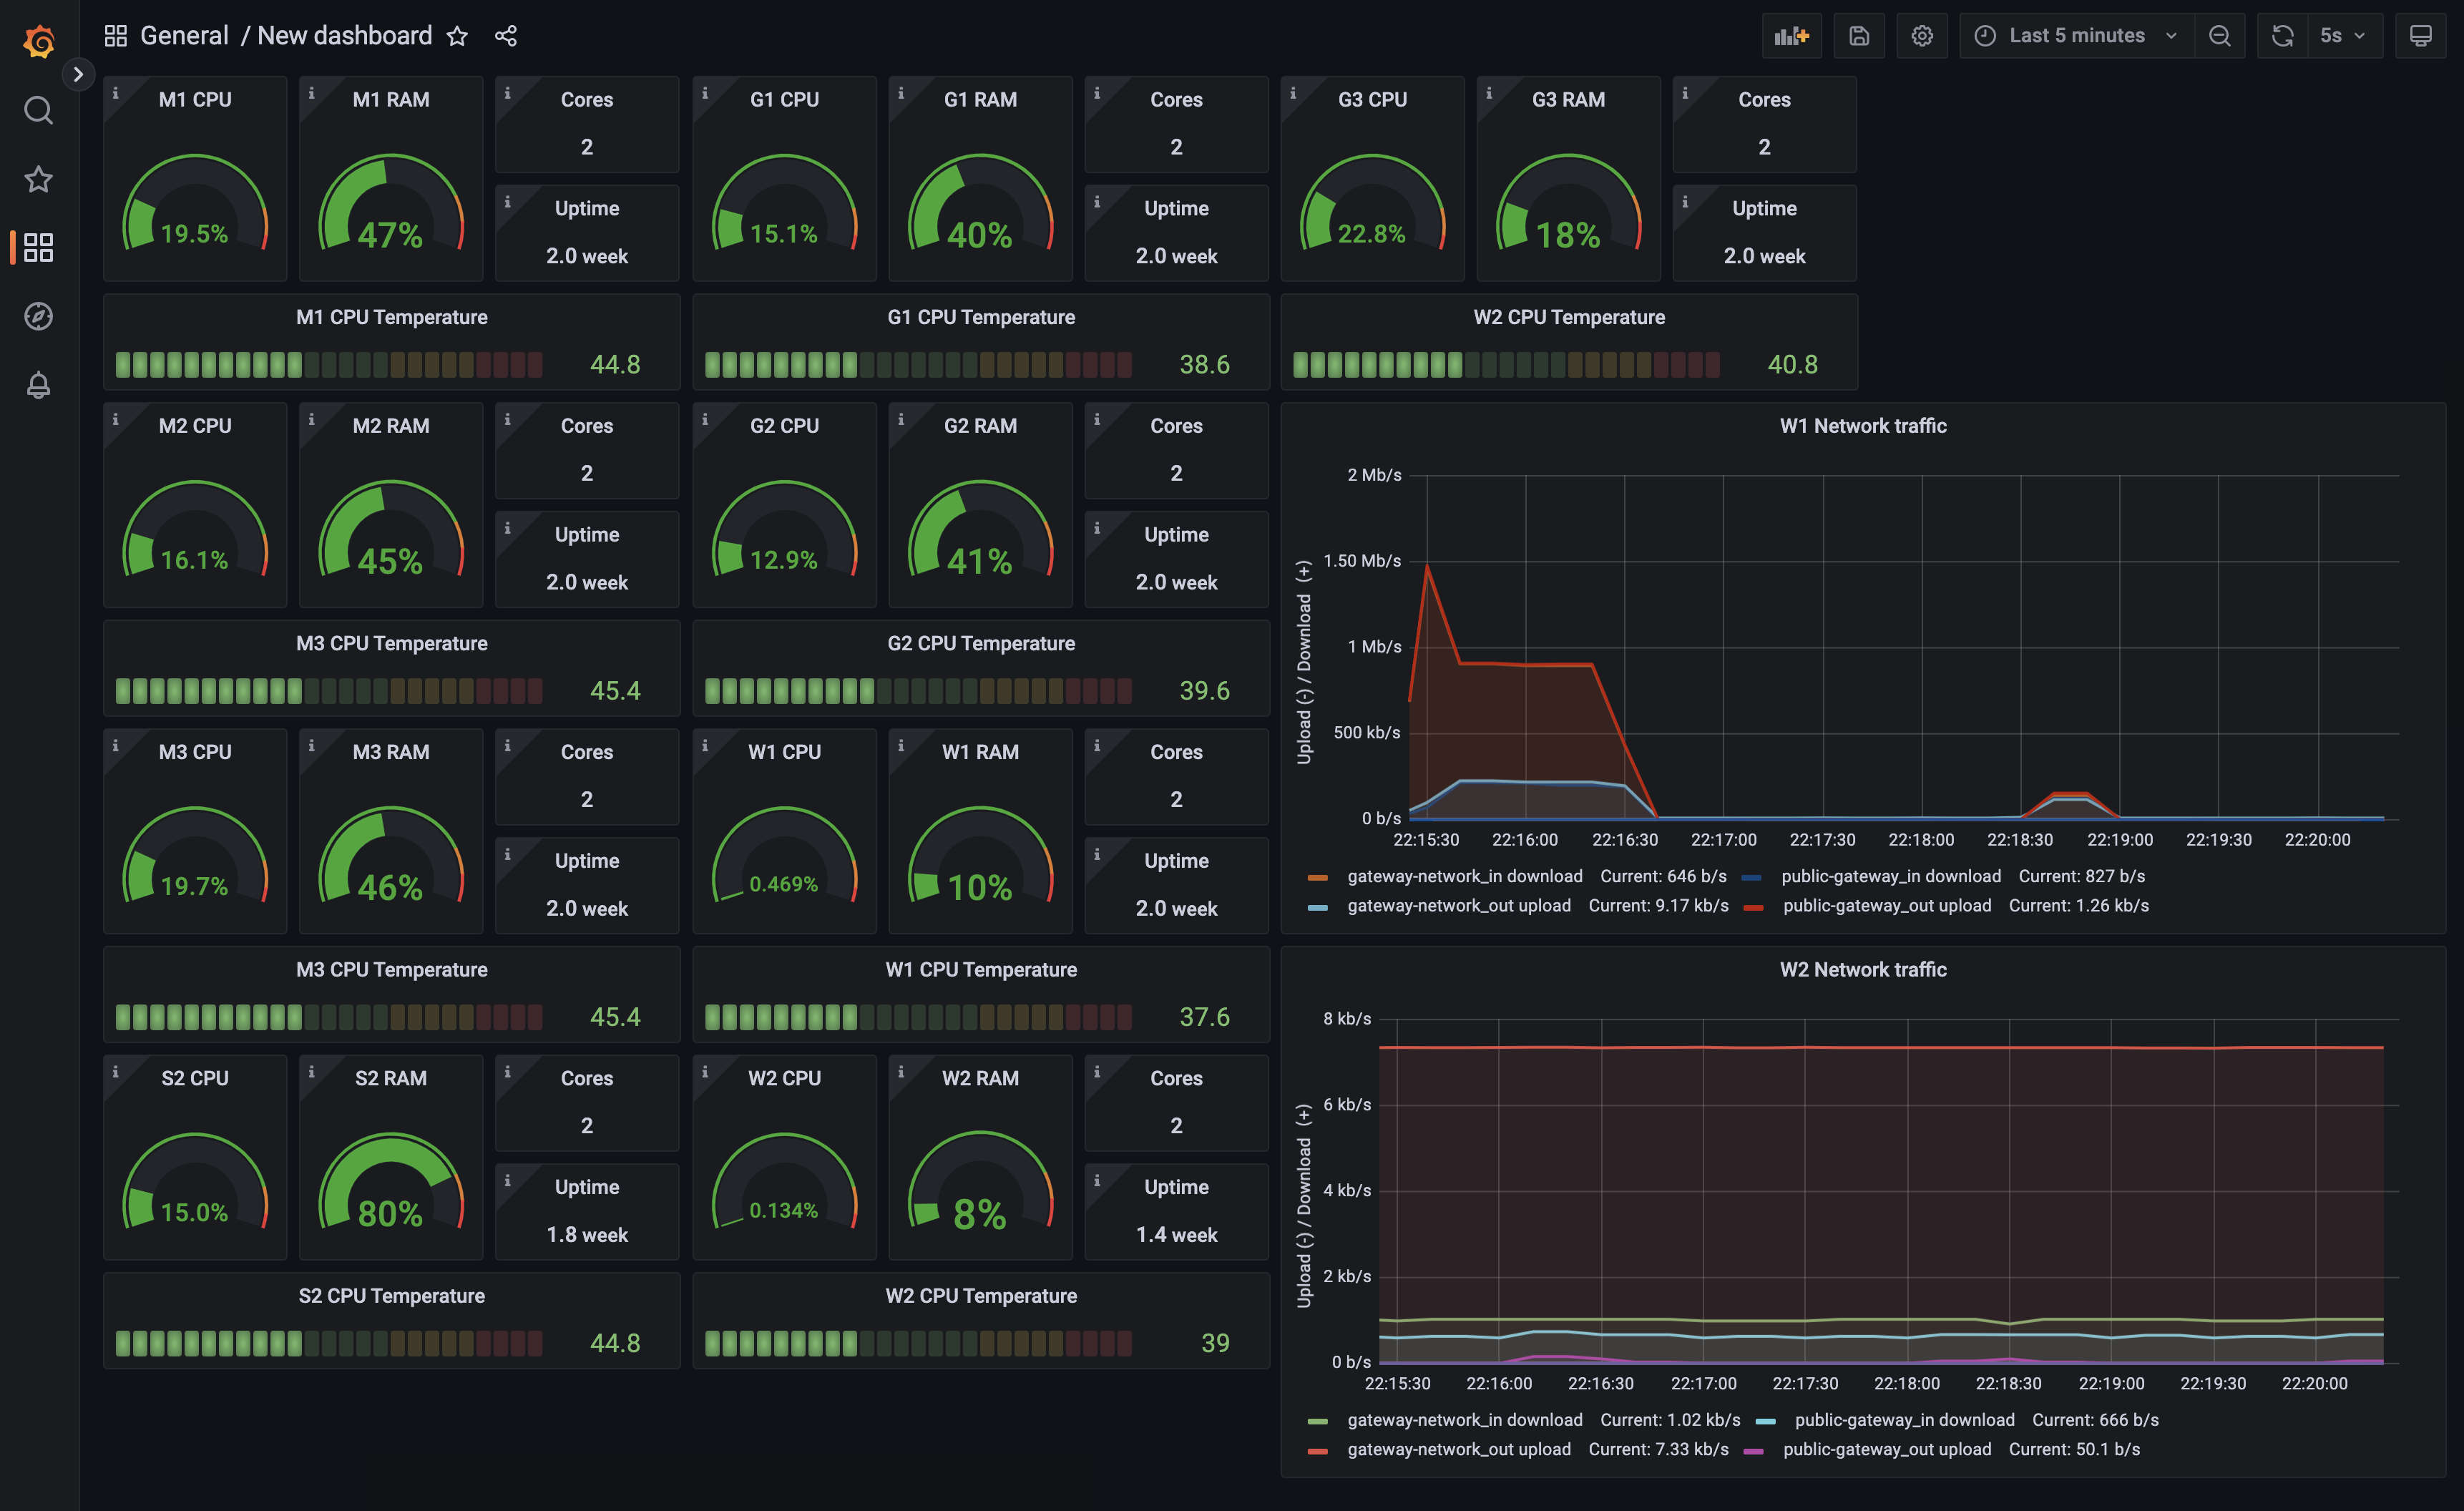
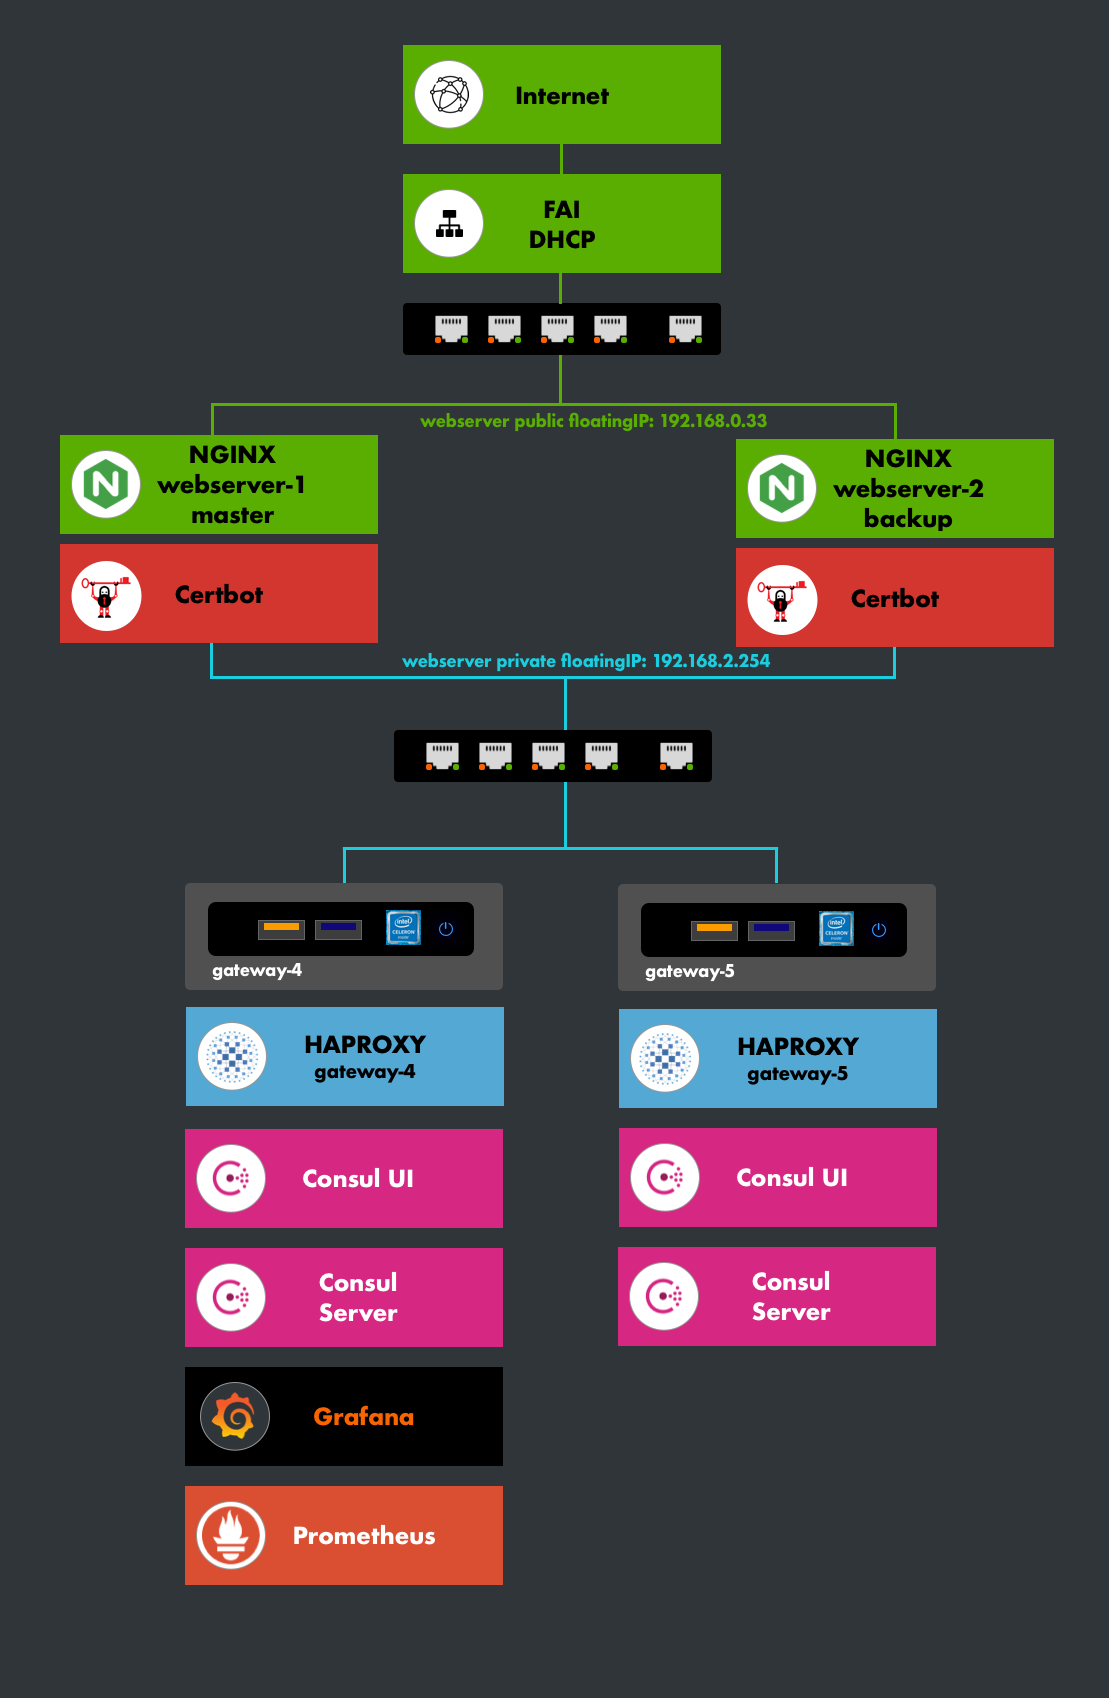
Hardware monitoring is managed by one of the servers in the nat_gateway_pool. Various data is collected from each server in the cluster (CPU, RAM, Disks, Networks, etc.) and centralized on the monitoring server. This data is used by Prometheus to store, process, and serve the data, and by Grafana for visualization.
2. Architecture
3. Node-exporter
Node-exporter is an agent that allows exposing a machine's metrics. It is an API that queries the host and interfaces as a REST API to synchronize data with other systems such as Prometheus.
3.1. Installation
All servers in the infrastructure include Node-exporter. The installation is performed during the initialization phase of a machine in the infrastructure.
-------------------------------------------------------
| path: playbook-host-install.yml                      |
-------------------------------------------------------
- name: Install host
  hosts: host-x
  become: true
  user: supervisor
  roles:
    - role: monitoring/node-exporter
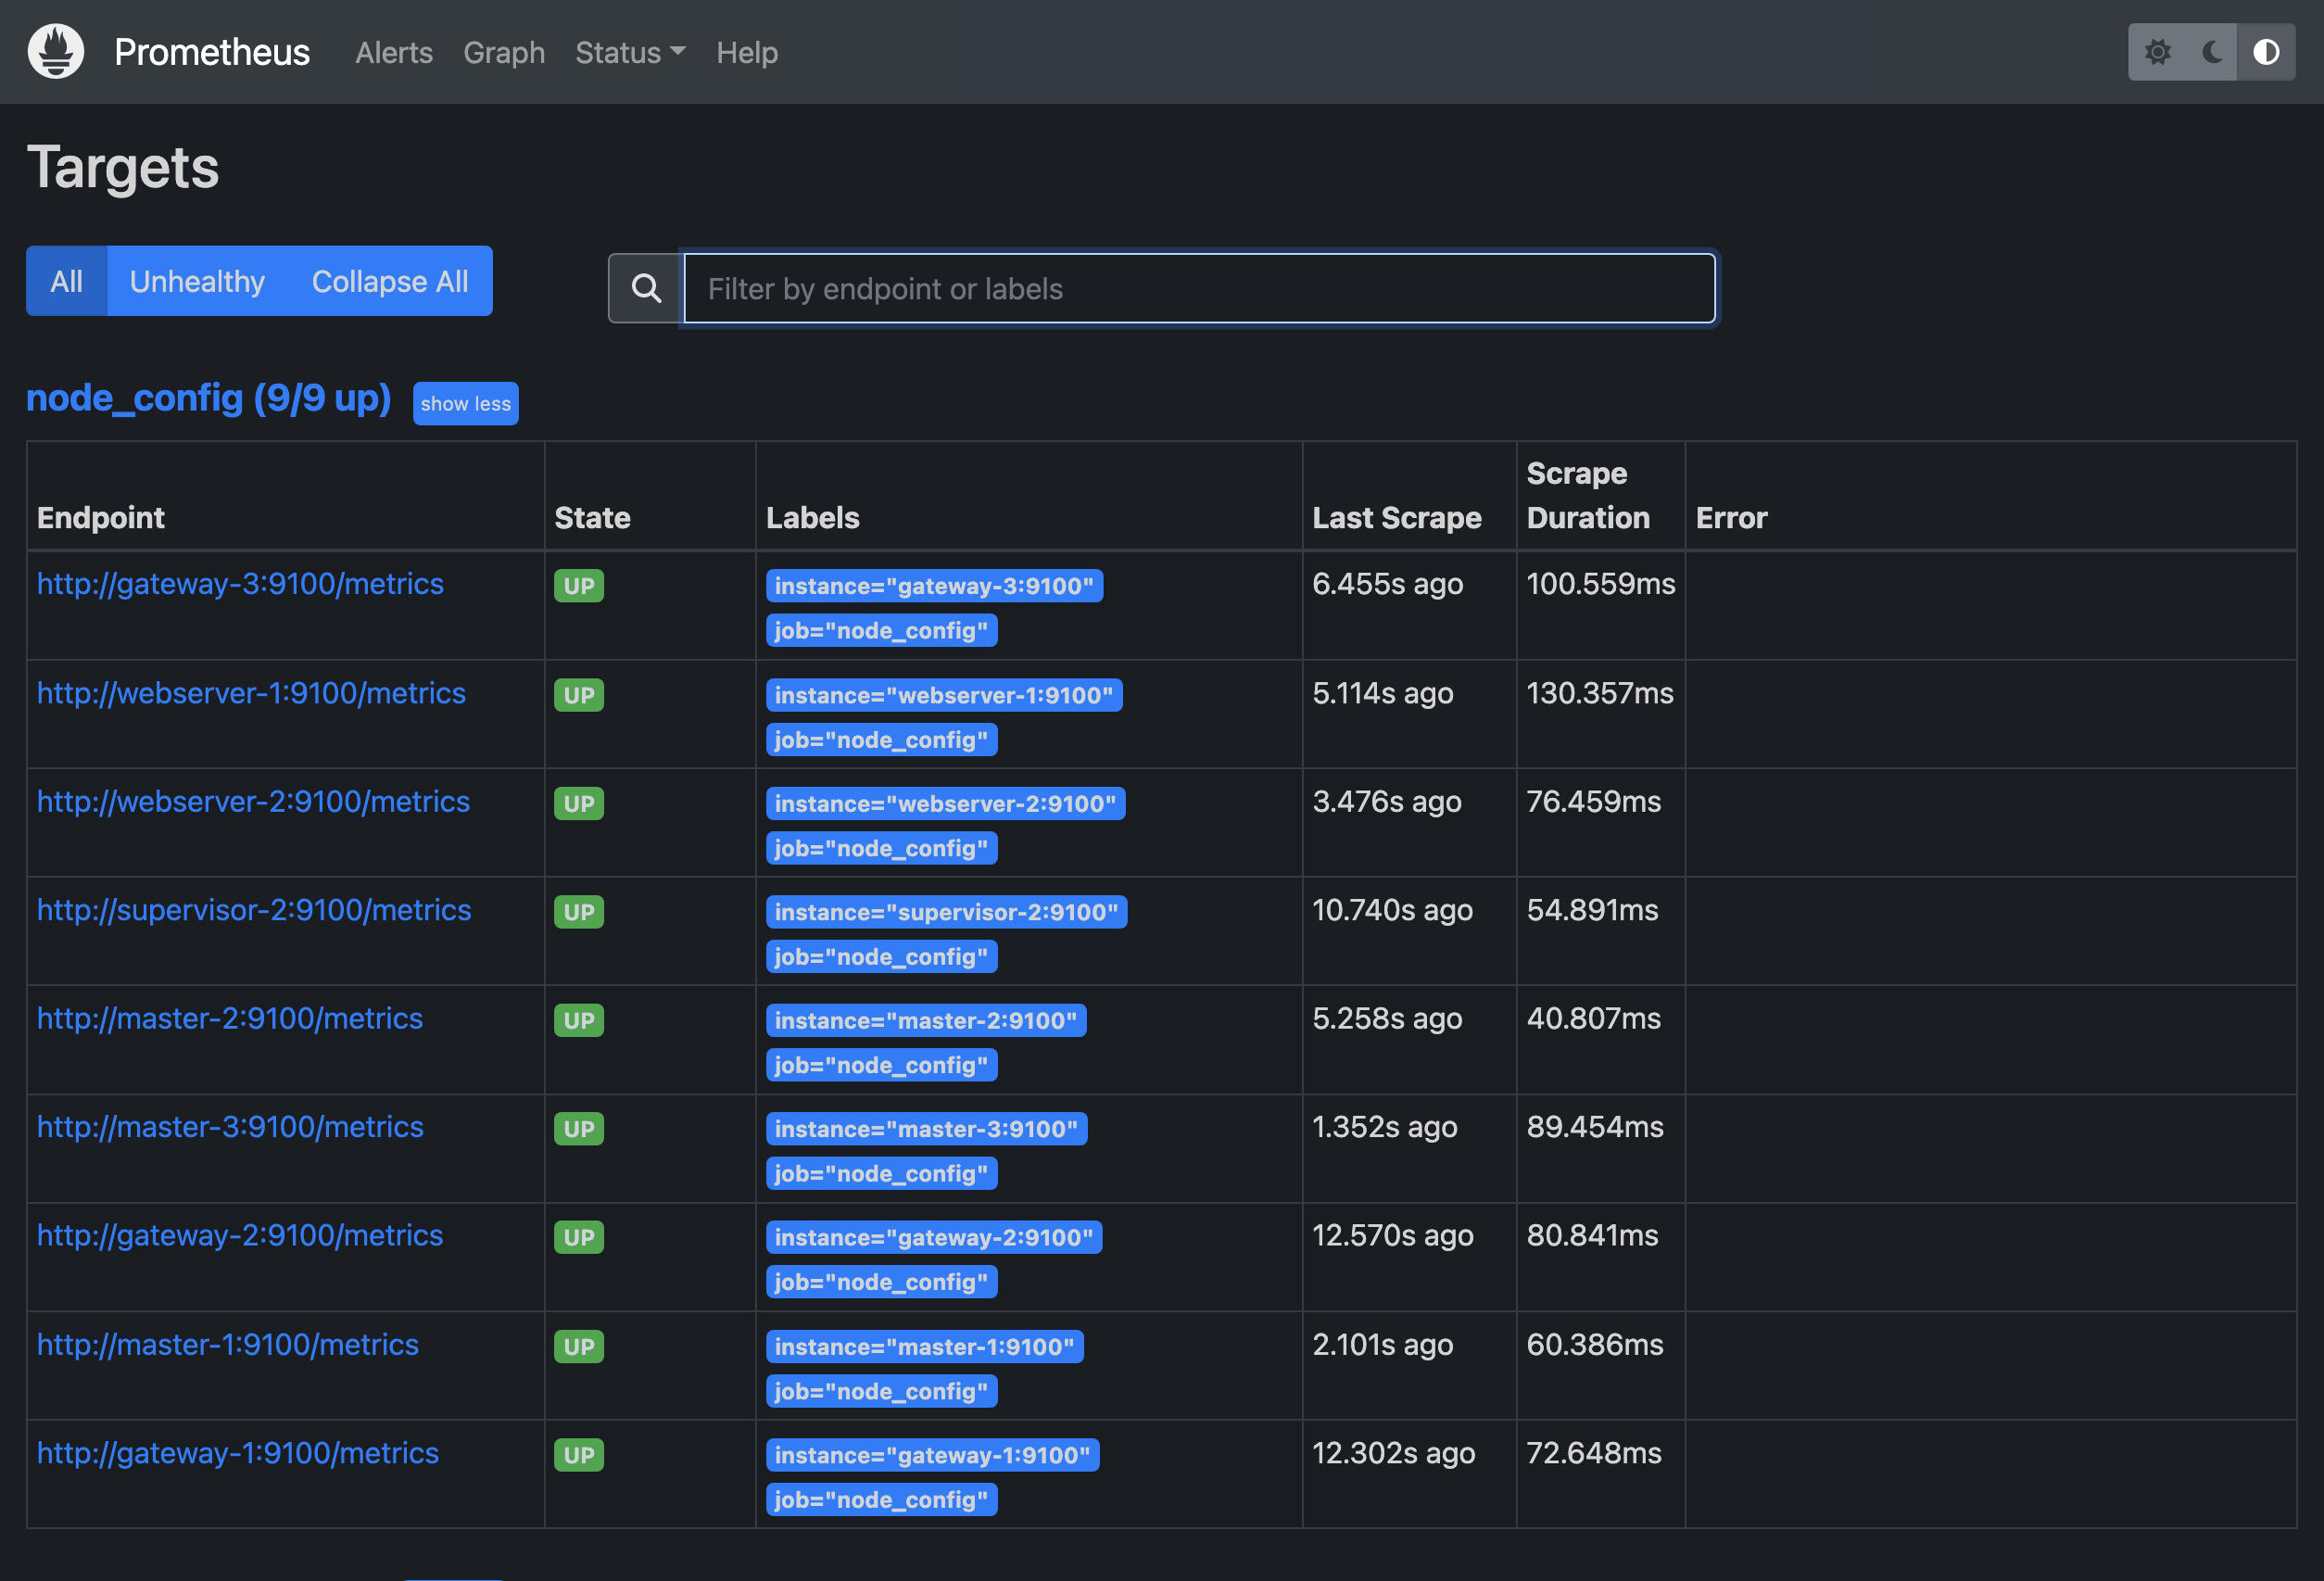
4. Prometheus
Prometheus is an open-source monitoring and alerting software. It records real-time metrics in a time-series database (with high acquisition capacity) based on the content of entry points exposed using the HTTP protocol. These metrics can then be queried using a simple query language (PromQL) and can also be used to generate alerts. The project is written in Go and is available under the Apache 2 license. The source code is available on GitHub, and it is a project maintained by the Cloud Native Computing Foundation alongside other projects like Kubernetes and Envoy. (Ref: Wikipedia)
4.1. Installation
-------------------------------------------------------
| path: playbook-supervisor-install.yml               |
-------------------------------------------------------
- name: Setup supervisor host
  hosts: supervisor-2
  become: true
  user: supervisor
  gather_facts: false
  roles:
    - role: monitoring/init
    - role: monitoring/prometheus <-------
    - role: monitoring/grafana
    - role: monitoring/kiosk
---------------------------------------------------------
| path: inventorie/protobox/webservers_pool/routes.yml  |
---------------------------------------------------------
prometheus:
  webserver:
    - location: /prometheus/
      params:
        proxy_pass:
          values: "http://stream_prometheus/prometheus/"
  stream:
    name: stream_prometheus
    port: 9090
    group: nat_gateway_pool
5. Grafana
Grafana is open-source software under the GNU Affero General Public License Version 3 (formerly under the Apache 2.0 license before April 2021) that allows data visualization. It enables the creation of dashboards and graphs from multiple sources, including time-series databases like Graphite, InfluxDB, and OpenTSDB. (Ref: Wikipedia)
5.1. Installation
-------------------------------------------------------
| path: playbook-supervisor-install.yml               |
-------------------------------------------------------
- name: Setup supervisor host
  hosts: supervisor-2
  become: true
  user: supervisor
  gather_facts: false
  roles:
    - role: monitoring/init
    - role: monitoring/prometheus
    - role: monitoring/grafana <-------
    - role: monitoring/kiosk
---------------------------------------------------------
| path: inventorie/protobox/webservers_pool/routes.yml  |
---------------------------------------------------------
grafana:
  webserver:
    - location: /grafana/
      params:
        rewrite:
          values: ^/grafana/(.*) /$1 break
        proxy_set_header:
          values: Host $http_host
        proxy_pass:
          values: "http://stream_grafana/grafana"
    - location: /grafana/api/live/
      params:
        rewrite:
          values: ^/grafana/(.*) /$1 break
        proxy_http_version:
          values: 1.1
        proxy_set_header:
          type: repeat
          values:
            Upgrade: $http_upgrade
            Connection: $connection_upgrade
            Host: $http_host
        proxy_pass:
          values: "http://stream_grafana/grafana"
  stream:
    name: stream_grafana
    port: 3000
    group: nat_gateway_pool